Workflow Diagram View
on 01-26-2026 12:00 AM by SnapApp by BlueVector AI
365
Workflow Diagram View
The Diagram View is an interactive, visual canvas designed for mapping out and organizing the logical components of a business process. It allows builders to drag and drop functional blocks to create a clear, directional map of how data and tasks move through the system.
Table of Contents
- Workspace Layout
- Core Components
- How it Works
- Building with Diagram View
- Configuring the Parent Workflow
- The Components
- 1. Action (Rectangle)
- 2. IF (Diamond)
- 3. ForEach (Circular Icon)
- 4. Query (Funnel Icon)
- 5. Timer (Clock Icon)
- Best Practices for Visual Building
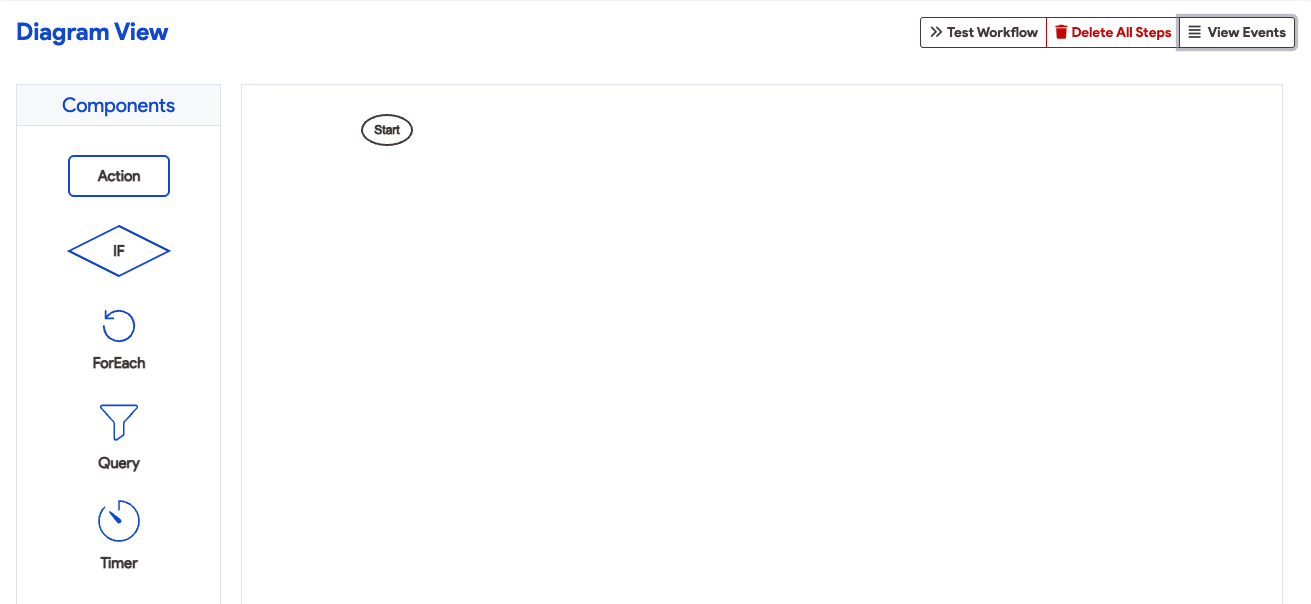
Workspace Layout
The builder is divided into two primary sections: the Components Panel and the Canvas.
- Components Panel: Contains the five primary building blocks (Action, IF, ForEach, Query, Timer) that define your workflow logic.
- Canvas: The drag-and-drop area where steps are arranged, starting from a predefined Start point.
Core Components
The diagram view is built by dragging and dropping specific functional components from the side panel onto the central canvas. These components correspond to the standard steps used in the SnapApp workflow builder:
| Component | Visual Shape | Description |
|---|---|---|
| Start | Oval | The entry point or trigger that initiates the business process. |
| Action | Rectangle | Represents individual tasks, such as updating a record or sending an SMS/Email notification. |
| IF | Diamond | A decision point where logic branches based on a “True/False” condition. |
| ForEach | Loop Icon | Used to create loops that process a set of data, such as performing an action for every record in a list. |
| Query | Filter Icon | A component used to retrieve specific data from a connected data source during execution. |
| Timer | Clock Icon | Allows the process to wait or pause for a specified duration before moving to the next step. |
How it Works
- Connectors: Arrows or lines link elements together to illustrate the sequence of actions and visualize task dependencies.
- Data Transformation: As work progresses, each step involves an input (data to initiate the step) and a transformation (the change that occurs) to result in a specific output.
- Real-Time Visualization: Users can see exactly where a record stands in its lifecycle by viewing its position on the map.
Building with Diagram View
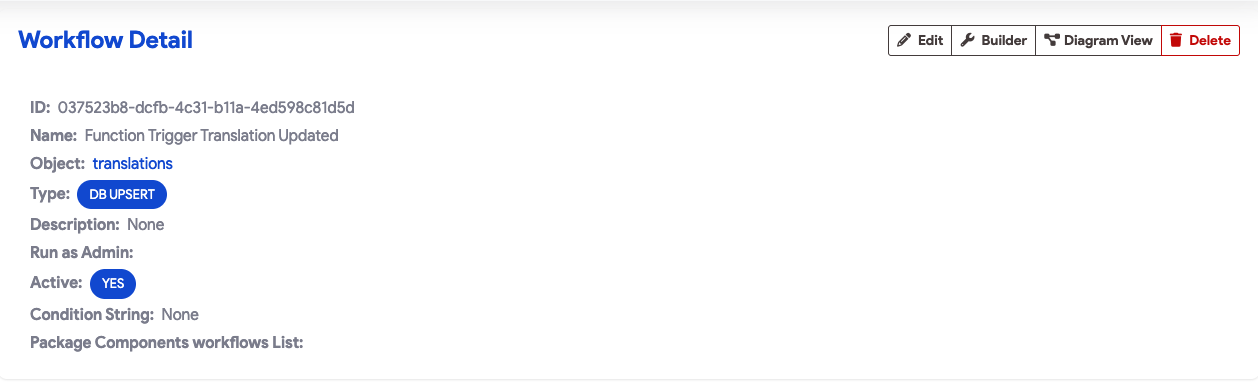
- Navigate to the Diagram View: Access the Diagram View for your specific workflow. Click the name of the workflow. In the top right of the workflow detail view, click the Diagram View button.
- Add Components: Select a component (Action, IF, etc.) from the Components side panel.
- Place on Canvas: Drag the component onto the workspace. You can use snapping tools to align objects to a grid for a clean layout.
- Connect Steps: Draw arrows to define the flow of operations starting from the Start point.
- Configure Logic: Select individual components to define their specific details, such as the body of an email or the logic for a decision diamond.
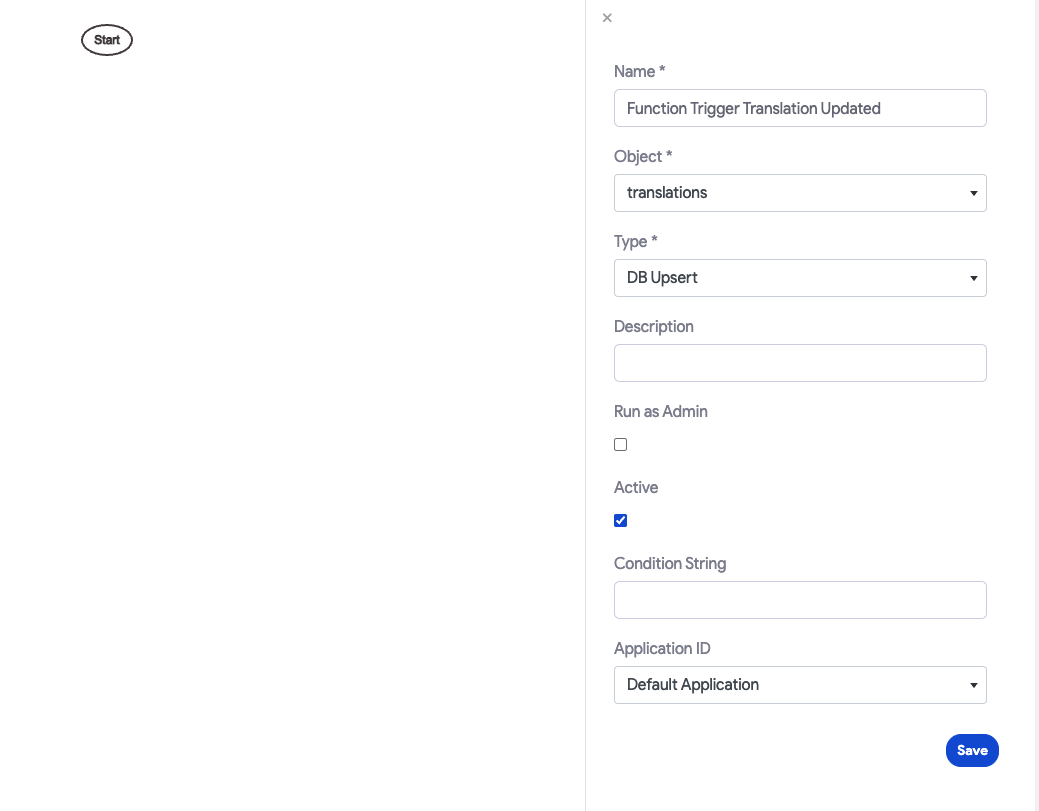
Configuring the Parent Workflow
Before adding logic, you must configure the high-level settings for the workflow. Clicking on any blank area of the canvas opens the parent configuration panel:
- Name: Provide a unique, descriptive title (e.g., “Function Trigger Translation Updated”).
- Object: Select the primary data table this workflow is tethered to (e.g., “translations”).
- Type: Choose the operational category, such as DB Upsert.
- Run as Admin: Check this box if the workflow requires elevated system permissions to execute.
- Active: A master toggle to enable or disable the entire workflow.
The Components
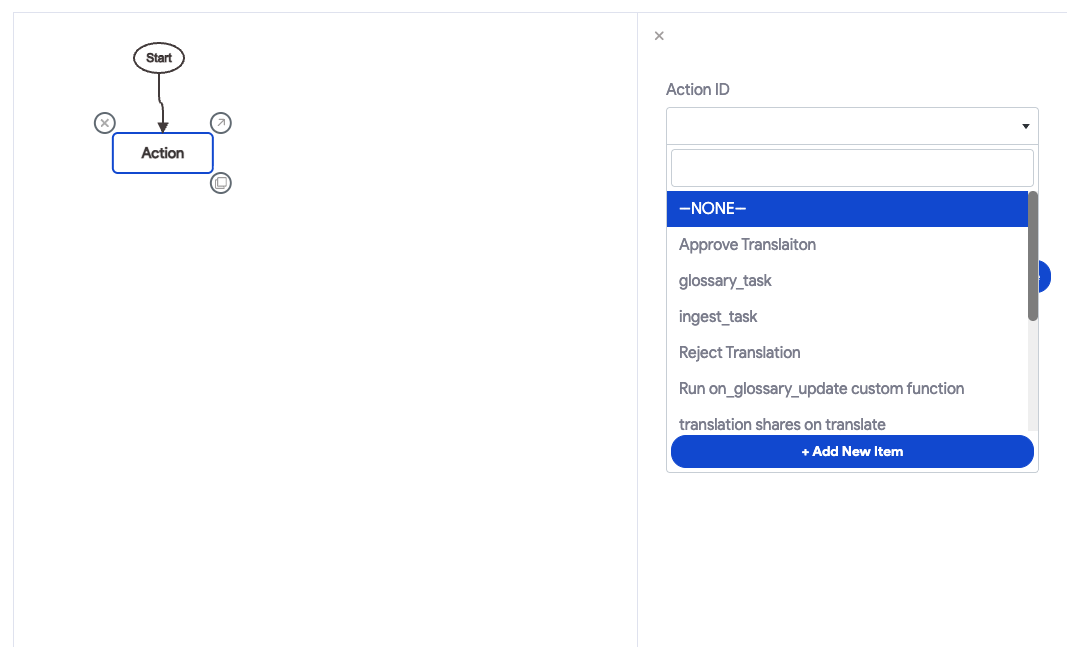
1. Action (Rectangle)
Action blocks execute specific tasks. When you place an Action on the canvas, you can:
- Choose from a list of previously created actions or click Add New Item to create a new action for the workflow.
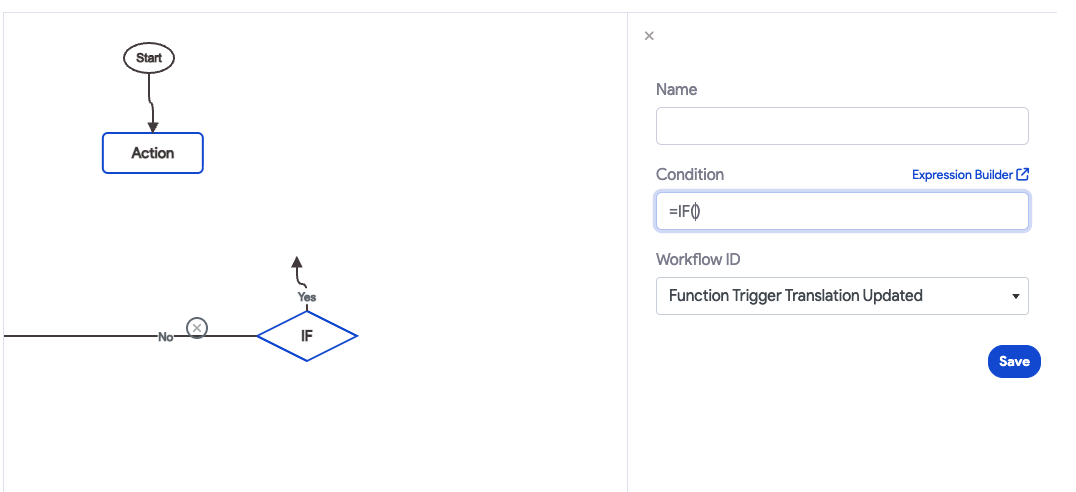
2. IF (Diamond)
The IF component creates branching logic. It automatically generates “Yes” and “No” paths:
- Condition: Write your logic using the
=IF()format. - Expression Builder: Click the link to use the visual logic tool for complex statements.
3. ForEach (Circular Icon)
Used to process collections of data. Configuration requires:
- Expression: Write a custom expression or use the Expression Builder to define the records to be looped.
- Workflow ID: Select the specific workflow ID the loop should iterate through.

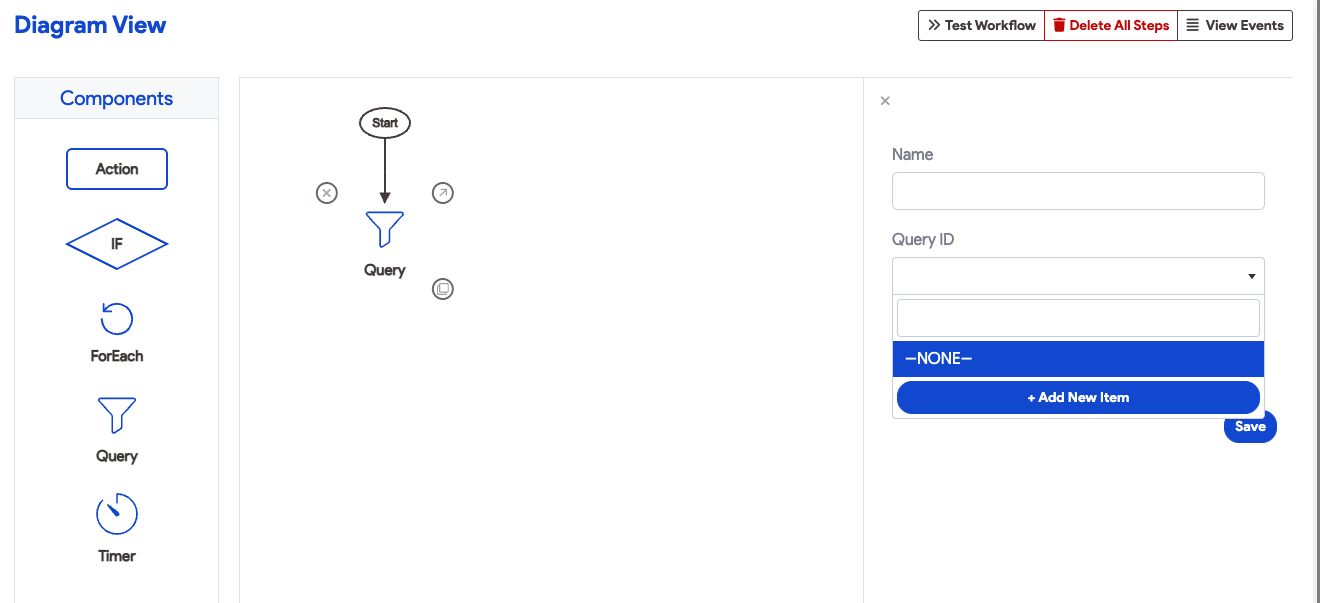
4. Query (Funnel Icon)
Query blocks interact directly with your objects and data sources. When added, you can:
- Select Existing: Use a previously created query from your library.
- Add New Item: Create a new Select, Update, or Delete query by clicking Add New Item.
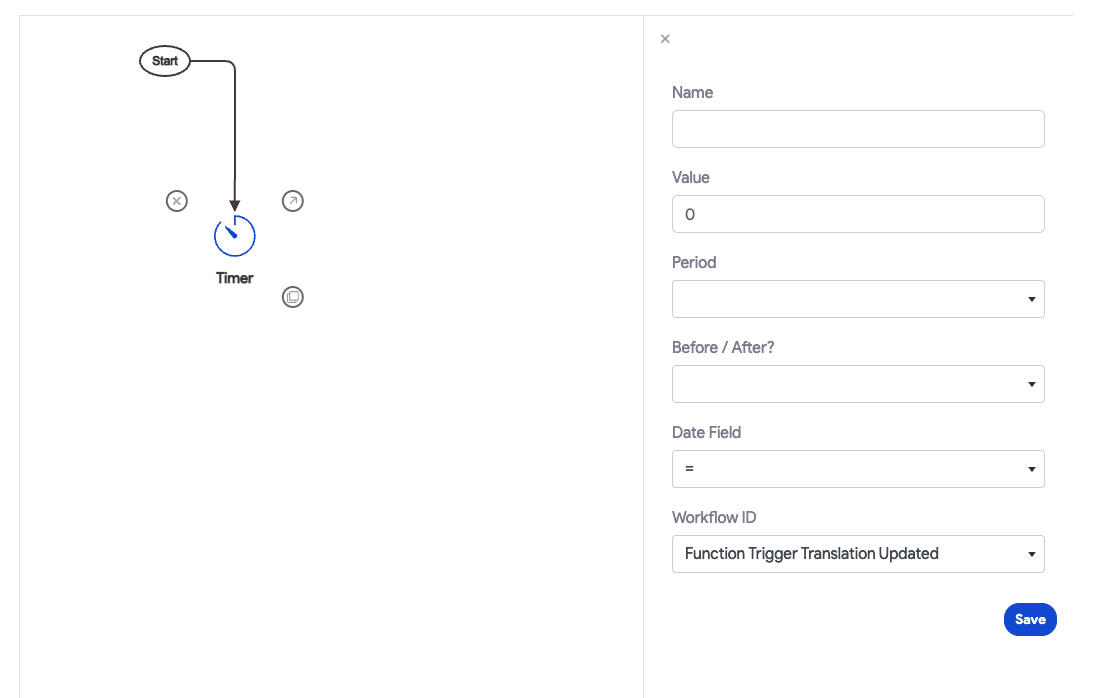
5. Timer (Clock Icon)
Timer blocks introduce scheduled pauses or delays. You must fill out the following fields:
- Value: The numerical amount for the delay.
- Period: The time unit (Seconds, Minutes, Hours, Days).
- Before / After?: Determines if the delay happens before or after a specific event.
- Date Field: Tether the timer to a specific timestamp field from your object.
Best Practices for Visual Building
- Logical Flow: Always draw your connectors from left-to-right or top-to-bottom to keep the diagram readable for other builders.
- Clear Naming: Give each component a unique name in its configuration panel to identify its specific purpose within the map.
- Validate Links: After adding a ForEach or IF block, ensure both the “Yes” and “No” (or loop paths) lead to valid end states or subsequent actions.
For support, email us at snapapp@bluevector.ai